Petroleum geologists make all kinds of contour maps. Contouring is not especially difficult, but it is easy to make small mistakes when the map gets very large. Your small mistakes might make the map invalid! It does take lots of practice and patience to make a nice-looking map.
In a large part of the United States, the Township and Range System is used to spot wells. This system is part of the Public Land Survey, that was established when the country was young.
How to make a countour map: Let’s assume we are making a map in one of the western states that uses the Township and Range system. In this area, a “section” of land is one mile on each side (one mile square). This also happens to be exactly 640 acres.
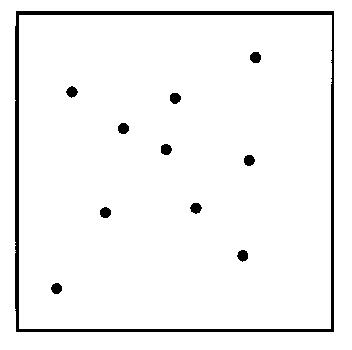
Step 1 – Spot The Wells
(1) You start by “spotting,” or drawing, all the wells on a one-square mile section of land. You need to know the distance of each well from a common boundary (the section line, in this case). You might get the exact locations from a scout ticket. Here’s a single section of land, with our wells spotted on it.
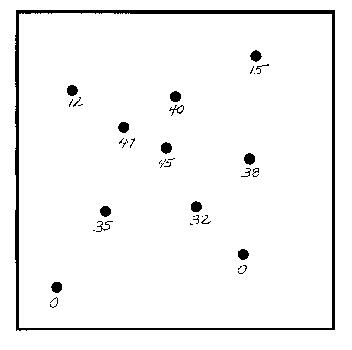
Step 2 – Put The Mapping Value On Each Well
(2) Next, you look at the electric logs for each well. We are going to make an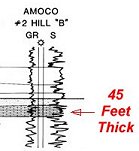 “isopach” map. An isopach map is a map that shows the thickness of something. In this case, it is the thickness of a limestone formation. Count the number of feet of sand in the zone you are interested in. Then, put the number of feet of sand below each well spot.
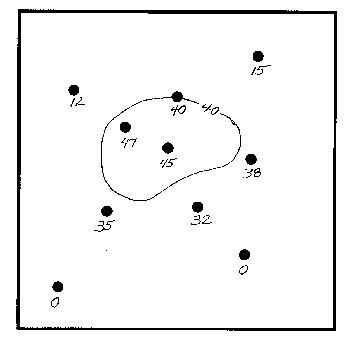
Step 3 – Start Contouring The Largest Values
(3) Start contouring with the highest values. Use a pencil. Start with a “contour interval” that is slightly less than the biggest values. In this case, the first line drawn is the 40-foot contour. As you draw your line, look carefully when you pass between two wells. Try to use your eye like a “ruler,” and position the line at the proper distance between the two wells. Notice the well with a footage of “38.” Since 38 is very close to 40 (the contour we are drawing), you should “pull” the 40-foot contour over close to the 38-foot line, like I did here. Actually, I should have pulled it a just little closer!
If there is a “40” on the map (there is on this one), you will draw the 40-foot line right through that well.
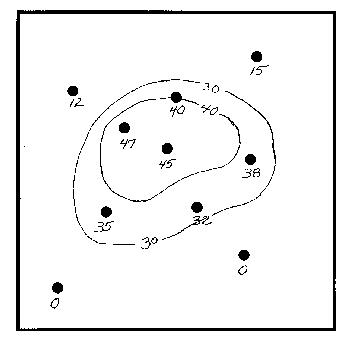
Step 4 – Draw The 30-Foot Contour
(4) Now draw the 30-foot contour (contour lines are usually at some even interval, like 10 feet, 20 feet, 50 feet). “Eyeball” the map and be sure to leave the proper amount of room for the remaining contour lines. Use a pencil, and draw light lines, because you have to erase a lot!!
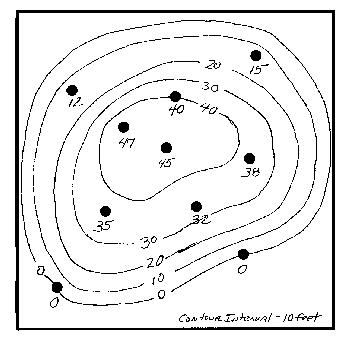
Step 5 – “Eyeball” The Rest Of The Countours
(5) Finish the map by drawing the 10-foot, and zero contour lines. Label the “contour interval” you used at the bottom of the map. In this case, the contour interval is 10 feet. You’re done!
It takes quite a bit of practice to draw decent contour maps by hand. The one we just did was a “quickie”. Normally, you would draw this in light pencil, then go back and make it better with ink.
The little map shown in the last step would still require a lot of erasing and reworking to get it looking just right.
It’s important to know how to contour a map, but these days, geologists use computers to do a lot of their contouring. However it still requires quite a bit of “help” from the petroleum geologist to make a good-looking map. Many geologists use computer contouring for everyday work, but draw it by hand when it must look nice.
When you’re done, after erasing and re-drawing quite a bit, the countours will look nice and even, like the map below:
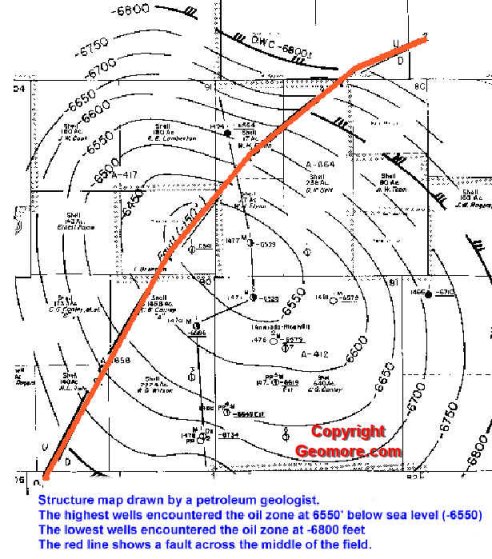
Hand-Drawn Structure Map
