Using Computers to Keep Track of Geological Data
Computers changed everything about the oil business, just like they changed most industries all over the world. I was fortunate enough to be a petroleum geologist for a few years before computers entered the picture. Back then, everything was still “hand-done” with pencils, ink, index cards and big sheets of paper.
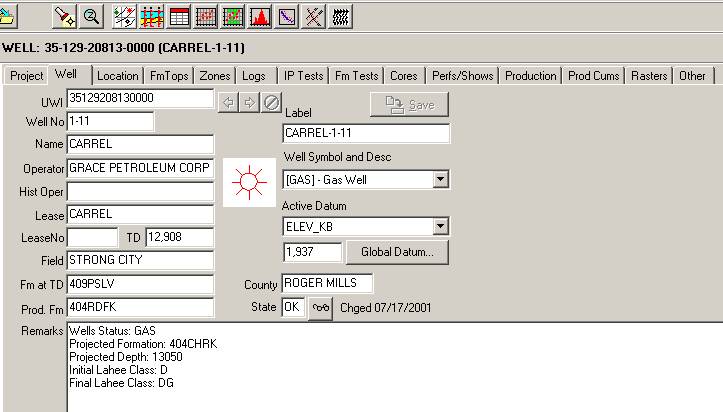
But, I welcome the coming of computers to the process. The picture below shows a tiny part of an older computer program used to manipulate digital data from thousands of wells. The Carrel 1-11 in Roger Mills County, Oklahoma, is the example.

Scout Ticket Data in a Computerized Format
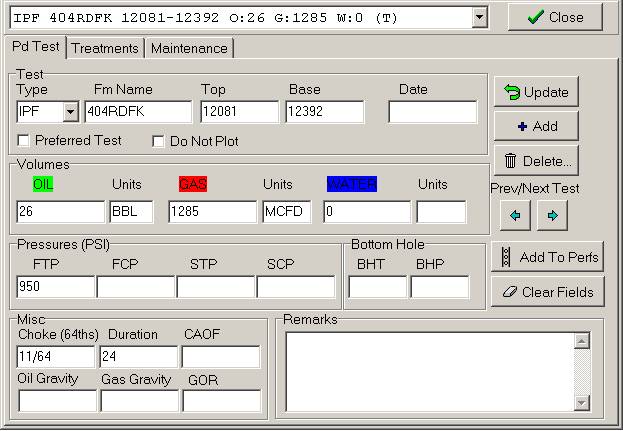
The next part of the program (below) gives information about the completion of the Red Fork formation in the Carrel 1-11. This is a decent gas well, neither extremely great nor extremely bad for its depth (13,050′). Note that the well’s “IPF” (inital production, flowing) initially made 1285 thousand cubic feet of gas per day plus 26 barrels of oil. The “flowing” part tells us that no pump was needed to produce this well….the hydrocarbons flowed out under their own pressure! This is a good thing!

Production Data
Under “Pressures,” you will see that the “FTP” (flowing tubing pressure at the wellhead in pounds per square inch, or PSI) was 950 pounds. This is a fair pressure, and indicates that the well is likely to produce for some time.
Just as an example, a well making 5000 MCFD with a FTP of several thousand pounds would make a petroleum geologist jump for joy. This ain’t one of those.

Production Graph
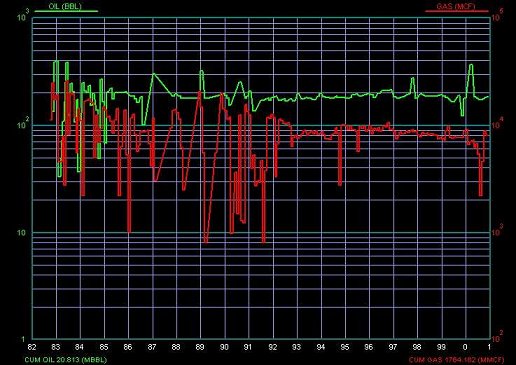
Finally, this graph shows the entire production history of the Carrel 1-11. Notice that the well started producing in late 1982. Oil production is shown in green, and gas production is red. Oil is given in barrels per month (scale on the left, numbers are exponential notation ) and gas is shown in MCF (thousand cubic feet) per month (scale on the right). In 1996, oil production was about 200 barrels per month (green scale on left) and gas production was about 9500 MCF per month (red scale on right).
Notice that cumulative production of 20.8 thousand barrels of oil and 1,764 million cubic feet (OR 1.7 billion cubic feet ) is given at the bottom of the chart. In 2005, oil sold for about $50 a barrel and gas sold for about $6 per MCF. Therefore, the value of all the oil and gas produced through 2001 (At 2005 prices) is about $1.4 million dollars for the oil plus about $10.2 million dollars for the gas…for a total value of $11.6 million dollars.
Don’t forget that it currently costs about $2 million dollars to drill and complete a well like this one! If the well is no good (a dry hole), the $2 million dollars is lost. (when I first wrote these sentences back in 2005, the prices were correct. This well would probably cost between 6-9 million in 2021).
Exploration tests are usually defined as holes drilled more than one or two miles from existing oil or gas production. Only about 10% of all the exploration tests drilled produce enough oil or gas to pay for the cost of drilling them!
