Electric Logs
 Electric logs are one of the most important data sources available to the petroleum geologist.
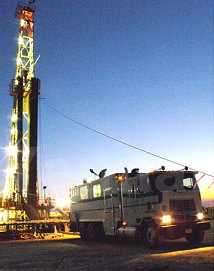
After a hole is drilled, the logging company will be called. Soon, they will show up with the logging truck. An electric-logging truck is an advanced scientific laboratory on wheels. Using the truck, the logging company will lower logging tools into the hole on a long cable called a wireline. The wireline is spooled out the back of the truck, over a pulley which is temporarily attached to the drilling derrick, and down into the hole.
Electric logging tools have several things in common, no matter the type. The tools are assembled on the location into a long, heavy pipe-like structure, 20 to 90 feet long. It is narrow enough to go into the hole, which is usually about 8-10 inches in diameter. The tools are lowered into the hole on a “wireline,” a thick, flexible sheathed cable that supports the log string and conducts electricity down to the “tools.” The wireline also transmits the tool readings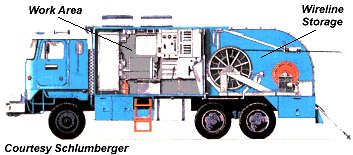 back up to the truck.
The truck carries several miles of wireline on a large spool mounted at the back of the truck.
There are hundreds of different kinds of electric logs, and the petroleum geologist will select the ones that will give him the the best data about the particular hole that is being logged. Common types of electric logs include gamma-ray, caliper, resistivity, density porosity, and neutron porosity. Several different tools are usually “stacked” together to make fewer trips into the hole.

Logging Tool Cutaway View
After the data is gathered, the logging engineer will produce a long piece of paper called an “electric log.” “Electric log” is a general description for any of several kinds of logs. Petroleum geologists get much valuable information from electric logs, including rock type, porosity, the presence of oil, water, or gas, and many other things. The electric log is the most important tool of the petroleum geologist.
On the other hand, electric logs are not fail-safe, and the results must be interpreted by an expert, with an extensive knowledge of the field conditions.
If the electric logs indicate that the well contains oil or gas in sufficient quantities to be economic, the PG will order that the well be completed. This is not a decision to be taken lightly, as completing the hole may easily double the cost. The day a petroleum geologist is forced to plug a well is a bad day for him. But sometimes this is necessary to minimize losses and to avoid throwing good money after bad.
Timing of Electric Logging Operations
Virtually all open-hole (no casing) logging takes place in the middle of the night. This is because the production foreman, in charge of the drilling operations for the area, will conspire with the drilling contractor to ensure total drilling depth is reached around 9PM. This always ensures the geologist will stay up all night, while allowing the petroleum engineers to get a good night’s sleep.
It will take a few hours to circulate the hole clean prior to logging. After “rigging-up,” the first tool will typically go in the hole at about 1AM. The logging job will then last at least until daybreak, no matter how simple or complex. If very complex, the job will not end until day break the following morning. This will ensure no petroleum engineers will have to work anytime other than normal daylight hours. If the hole is in bad shape (caving or otherwise), it may not be possible to get a log at all. This will make completion of the hole much more of a guess, and considerably more risky.
In contrast to the timing for open-hole logs, cased-holed logs (logs run in a hole lined with steel casing) are always run between 10AM and 3PM, with a generous lunch break in the middle. This is because cased-hole logs are usually the domain of the engineers and production foreman, and no geologist is needed to “watch” them.
The Gamma-Ray and Resistivity Log
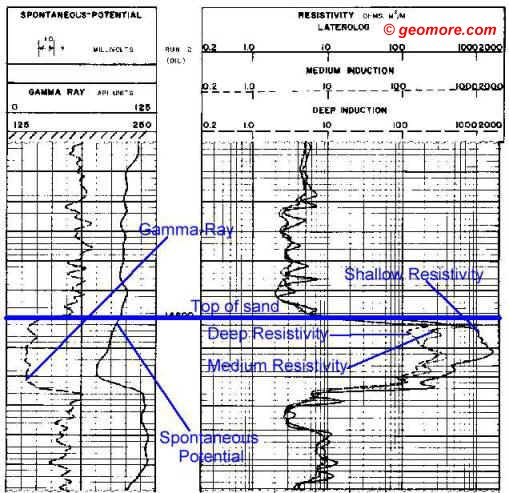
Take a look at the picture of an electric log below. This is the log from a “resistivity run,” using a combined tool “stack” (several tools attached together). The stack may consist of a a gamma-ray tool, a caliper tool, and three different types of resistivity tools. The log generated from this run is called a “gamma-ray/resistivity log.”
The Gamma-Ray Portion
The gamma-ray tool reads natural gamma-ray radiation given off by rocks. Shales release a lot of natural gamma-rays, so they read high on the gamma-ray log. Sandstones and limestones do not release many gamma-rays, so they read low. The gamma-ray log is shown on the far left side. The scale, calibrated in gamma-ray API (American Petroleum Institute) units, is at the the top (0-125). There are 10 divisions on the gamma-ray scale, so each division=12.5 units. If the curve (wiggly line) should run off the right side of the log (a lot of gamma-rays), it will reappear on the left. If the curve reappears on the left, the “backup scale” (125-250) is then used to read the value.
The thick black horizontal lines drawn on the log represent 10-foot depth sections. The thinner black lines between them are 2 feet of depth each. I drew a thick blue line on the log at a depth of 14,600 feet. This is called “picking the top” of a sandstone. “Picking” tops is a very important part of reading electric logs.
Look just below the blue line, and you will see the gamma-ray log is reading about 15-20 units. This low reading indicates a sandstone or limestone. Now look above the thick line. The gamma-ray is reading about 62 units. This indicates a shale formation. Sandstones and limestones are usually easy to tell from shales when you have a gamma-ray log, because the gamma-ray readings in sand or limestone are usually less than about 40 units. Exceptionally clean, nice sandstones or limestones (the kind we’re usually looking for) often read 20 units or less.
The Resistivity Portion
Now look at the right side of the above resistivity log. There are three curves here. Each curve measures the resistivity of the rock, including the fluid contained in the rock. The reading is made in “ohms,” which is a measurement of resistance of the rock formation to the flow of electricity. Porous formations containing mostly salt water (the kind of water normally found deep underground) have low resistivity, often just a couple of ohms. Formations that contain oil and gas have higher resistivities…perhaps 50-500 ohms.
Perforating a salt-water zone is expensive and wasteful, and the PG wants to avoid that! That’s one purpose of logging. The vast majority of deep porous rocks hold only salt water!
The three curves each electronically “look” a different depth into the rock.. The one we are most interested in is marked “Deep Resistivity,” and is drawn as a line with long dashes. This logging tool “looks” sideways into the the rock, to a depth of 6 feet or more. At this distance from the borehole, the natural oil or gas in the rock is usually undisturbed by the drilling process, so we can get a really good resistivity reading. Within the sandstone shown here, the deep resistivity reads up to 300 ohms. This very high resistivity indicates a reservoir that may contain oil or gas. But to be sure of this, we need to know something about the porosity of the rock, so we need another type of log. That’s because rocks with little or no porosity also have very high resistivities, but generally will not produce any oil or gas (There is now an exception to this. New technology has made it possible to extract oil and gas from formations that could not be economically produced 10-15 years ago. See Shale Gas).
Another Log — The Porosity Log
Now, let’s look at a second log, the “porosity run.” On the left is a log you are familiar with, the gamma-ray log (solid line). It is so useful it is usually run on every logging trip into the hole. Near the gamma-ray log is a “caliper” log. This simple log measures the width of the drilled hole, in inches. The caliper scale is at the top; 6-16 inches, and the curve is shown by a thinner, dashed line.
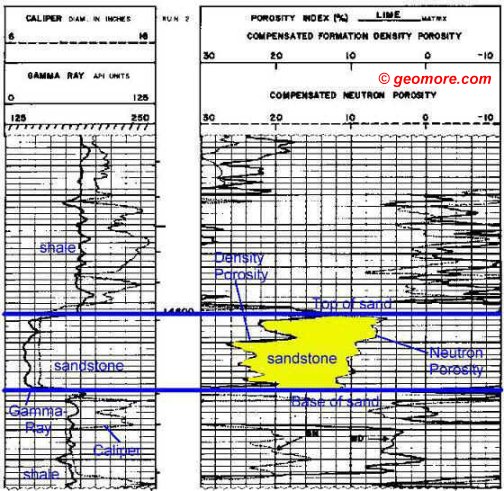 Notice that the hole is very large through the shale formations (almost 16 inches) and narrow through the sandstone (about 8 inches). This is because the shales are relatively soft (as far as rocks go) and they have been “washed out” (the hole has been widened) by the circulating drilling mud. The sandstone is harder, and does not wash out so easily, so the hole size shown on the caliper is much closer to the actual size of the drill bit. In the sandstone, the hole is a little more than 8 inches in diameter.
On the right side of the log are two types of porosity measurements — density porosity and neutron porosity. These measurements are taken from two different tools.
The scale at the top of the log shows (negative) -10% porosity on the right, 0% about 1/4 of the way over, and 30% porosity on the left. Clean sandstones have an absolute maximum of about 28% porosity. Shale porosity is much higher, but because the grain size of shale is so small, oil or gas trapped in shale cannot usually be removed by drilling for it (the exception is with horizontal drilling and fracking in shale gas formations), so shale porosity is generally not important in a conventional well. Mixing shale (or mud-sized particles) into the sandstone formation also screws up the log readings! Since very few sandstones are that clean, there is a lot of room in log interpretation to make an error.
The Neutron-Density Portion
The density log tool contains a highly radioactive gamma-ray source that is beamed into the formation. A radiation counter is mounted higher on the tool. Radiation passes into the rock and is recorded by the counter higher on the tool. If the rock is heavy and dense, few gamma-rays reach the counter. If the rock is light and porous, like many sandstones and porous limestones, a lot of gamma rays reach the counter. The curve is mathematically adjusted until it reads approximately “true” formation porosity, and this is recorded on the log. In the sandstone above, the density porosity is about 18-24%…..in other words, 18-24% of the rock is made up of holes ! That’s a very good thing!
The neutron log is a type of porosity log that measures the hydrogen present in the water atoms in a formation. Since shales contain a lot of water, bound up tight in their tiny pores, the neutron log reads very high porosities in shale formations. So, the PG must look at the gamma-ray log first to see if the rock is shaly. If it is, the neutron porosity doesn’t mean much!
Look above the sandstone on the neutron log, and you will see that it is running “off-scale” to the left. When gas is present, the neutron log reads low porosity (in this case, 8-12%), and there is a big spread between the density and neutron curves. This spread (I colored it yellow on the log) is called “gas effect.” The presence of sandstone also causes the two curves to spread, but not nearly so much as gas effect. Geologists like to see gas effect!
The resistivity and the neutron-density are just two of the many types of electric logs, but they are very commonly run.
Putting The Log Measurements Together
Logging a Well
Geologists use the measurements from both the density and neutron logs, and combine the two numbers together with a chart or a math formula. The result is the PG’s best guess as to the actual porosity of the formation. Most zones drilled through sandstones require about 8% porosity to produce hydrocarbons in sufficient quantity to pay for drilling the well.
The PG combines the porosity measurements with measurements from the resistivity run. The result gives the geologist an idea of the percentages of oil, gas, and water in the formation. If he has cores, so much the better!
After the logs are analyzed, a decision is made to either complete the well or plug it. Completing it means that heavy steel casing will be run into the hole, and cement will be pumped between the outside of the casing and the inside of the drilled hole (this area is called the annulus). Holes are then shot through the casing (using a powerful explosive charge) from the inside of the pipe at the depths where the geologist thinks the oil or gas is located.
When oil or gas finally comes from the hole, the PG officially has a “well,” not a “hole!” A “hole” is not a “well” until it produces oil or gas!
If the hole contains no economic amounts of oil or gas, it will be “plugged.” This usually means no expensive casing will be run (other than the “surface casing”…. which is always run to protect ground water). The hole is plugged with cement, the casing is cut off well below ground level, the casing is capped, and the land is returned to normal. In a few years, you would never know a hole had been drilled there, if it is all done correctly.
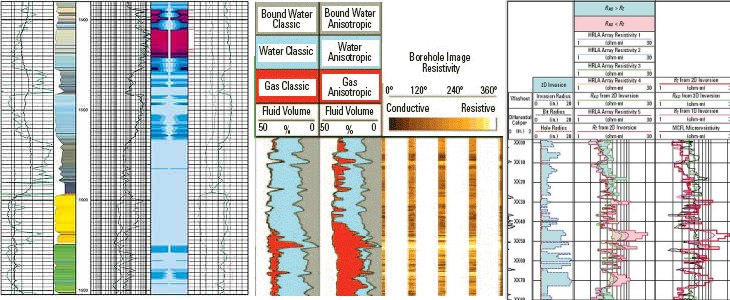
Various Types of Electric Logs
